


PETERSBURG, Fla.— Twelve months after shopper intelligence leader Catalina began closely tracking the impact of escalating coronoavirus concerns on shopping and buying behavior at grocery and drug stores across the country, several categories have experienced strong sales spikes, while others continue to struggle.
Also, in looking back at the past 52 weeks of data beginning with the week ending Feb. 15, 2020, shoppers made more trips than average in March as the pandemic set in, but drastically reduced trips in April as they began sheltering at home. The lingering impact of lockdowns paved the way for a nine percent average decline in weekly, in-person shopping trips starting in May 2020, compared to the prior year. While people, by and large, have been shopping less, they’ve been buying more. Spending per trip has increased by 23 percent on average, compared to 2019. Overall, average weekly spending on groceries has increased by 12%.
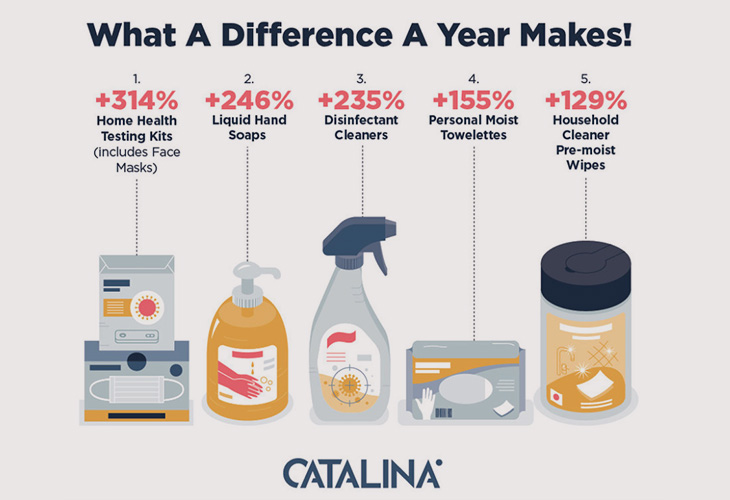
The Top 5 categories seeing the greatest sales growth over the past year literally help keep the coronavirus at bay:
- Home Health Testing Kits (includes Face Masks) – up 314%
- Liquid Hand Soaps – up 246%
- Disinfectant Cleaners – up 235%
- Personal Moist Towelettes – up 155%
- Household Cleaner Pre-moist Wipes – up 129%
Since face masks account for 80% of the home health testing category, the strong sales performance has increased throughout the year as the Centers for Disease Control and the Biden Administration have emphasized how they can markedly reduce the risk of COVID-19 transmission.
Eight of the next 10 top-selling categories are either food or beverages that show an increased appetite for convenience and/or comfort. The outliers are the Camping/Sports Accessories category, which reflects consumer excitement to return to the great outdoors as “shelter at home” restrictions were lifted when warmer weather set in; and Fire Logs, which demonstrate the popularity of gathering around bonfires in Summer and Fall, while warming up in front of home fireplaces during colder weather.
- Refrigerated Snacks/Cakes – Up 87%
- Juice – Frozen Drink Smoothies – Up 85%
- Frozen Vegetables Breaded – Up 83%
- Powdered Milk – Up 82%
- Camping/Sports Accessories – Up 77%
- Frozen Seafood – Up 71%
- Bacon: Light/Turkey/Chicken – Up 65%
- Baking/Biscuit Mixes – Up 64%
- Breakfast Drink Mixes – Up 61%
- Fire Logs – Up 53%
The rise of home baking during the pandemic has been well-documented and is underscored by data over the past year showing sales of Flour increased by 55%, Refrigerated Dough/Sweet Rolls up 46%, Brownie & Cookie Mixes up 45% and Shelf-Stable Pie Shells up 44% and Refrigerated Cookie/Brownie Dough and Yeast, both up 36%.
Just as Powdered Milk and Baking Mixes had shown modest declines in the early “pre-pandemic” weeks of 2020, several other categories that were struggling also saw impressive sales spikes as the year progressed: Baking Extracts up 48%; Canned Pork & Beans and Chlorine Bleach both up 45%, Canned Meat Stew up 41%; and Marshmallows up 40%.
With the majority of bars and restaurants either closed, open only for takeout, and/or offering limited seating, adult beverages experienced strong sales upticks this past year, with Premixed Cocktails/Coolers up 84%, Domestic Beer/Ale up 31%; Imported Wine up 28%, Domestic Wine up 25%, Spirits up 24% and Imported Beer up 23%.
Bathroom Tissue, the subject of much-publicized panic buying in the early days of the pandemic, ended up experiencing a 33% and 30% uptick in premium and value brand sales respectively over the past 12 months.
With so many Americans encouraged to work and attend school from home, there has been a noticeable decline in sales of personal care products over the past 12 months:
- Wrinkle Reducers – down 27%
- Breath Fresheners – down 26%
- Face Cosmetics – down 20%
- Cosmetics Remover – down 19%
- Eye Cosmetics – down 11%
- Hair Care/Styling – down 9%
Likewise, with fewer opportunities for people to personally interact in business and social settings, several categories that experienced declining sales pre-pandemic continued that trend:
- Hosiery & Tights – down 33%
- Men’s Toiletries Gift Sets – down 25%
- Make-up Gift Sets – down 25%
- Shoe Polish & Laces – down 20%
- Weight Loss Pills – down 15%
- Alertness Aids – down 4%
- Stationery/School Supplies – down 3%
Applying the Data
Catalina’s data scientists and advanced analytics teams rely on the company’s extensive Buyer Intelligence Database, which captures up to three years of purchase history and more than two billion Universal Product Codes, to track past shopping behavior. Then they apply their analytics skills and a combination of Artificial Intelligence and Machine Learning tools to help retailers and CPG brands develop marketing, media and activation strategies that both predict and influence purchase decisions in real time.
“We’ve painstakingly categorized shoppers into hundreds of customized audience segments on an anonymized basis in recent years. Knowing the type of products and brands they are likely to put into their carts allows us to tailor highly effective marketing messages and promotions, and deliver them across the most efficient media channels to trigger purchases,” said Catalina CMO Marta Cyhan. “Doing so in the midst of a pandemic — when shopper behavior has changed so profoundly — benefits both retailers and brands, as well as their customers who are appreciating value more than ever during these uncertain times.”

You must be logged in to post a comment Login